


Counting Crowns in Nepal: Mapping Vegetation and Land Cover with eCognition Software
Customer Company Size
Large Corporate
Region
- Asia
Country
- Nepal
Product
- Trimble eCognition
- Esri ArcGIS
- QuickBird Satellite Imagery
- Ikonos Satellite Imagery
Tech Stack
- Satellite Imagery
- Digital Elevation Model (DEM)
- Geospatial Analysis
Implementation Scale
- Departmental Deployment
Impact Metrics
- Environmental Impact Reduction
- Digital Expertise
Technology Category
- Analytics & Modeling - Predictive Analytics
- Application Infrastructure & Middleware - Data Exchange & Integration
Applicable Industries
- Agriculture
Applicable Functions
- Field Services
- Business Operation
Use Cases
- Predictive Maintenance
- Remote Asset Management
Services
- Data Science Services
- System Integration
About The Customer
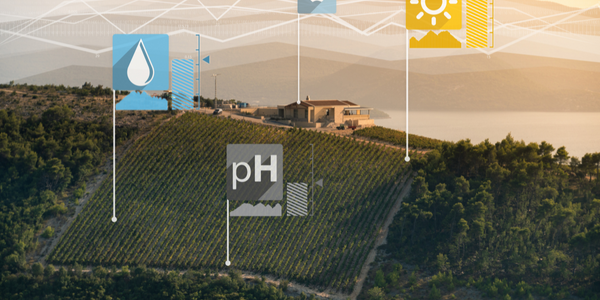
The small communities living in Nepal’s high mountain regions depend nearly exclusively on local natural resources for their livelihoods, yet they have to exploit those same resources in order to have shelter and carve out livelihoods. It’s a perpetual Catch-22 that has led to livestock overgrazing, overuse of water and loss of trees. In the remote mountainous region of Jumla, for example, around 90 percent of farmers subsist on agriculture production but their landholdings are so small, it’s challenging to harvest sufficient food. So often, families collect firewood, herbs and other ecosystem goods to augment their income and food resources. Compounding the situation, major changes in climate have reduced water availability, increased temperatures and produced a shift in growing seasons—all of which impact agricultural production, and further drive people to draw from the environment for goods. The geographic isolation of Jumla and other remote areas have made it difficult for Nepalese authorities to readily see how inextricably linked agricultural practices and environment deterioration have become. This has presented authorities with their own dilemma: how to develop initiatives to both improve agribusiness and strengthen the resilience of the natural resource environment.

The Challenge
Intent on improving Jumla’s plight, MoAC in 2010 launched the three-year High Mountain Agri-business and Livelihood Improvement (HIMALI) project. Specifically targeting two watersheds, one of which was the Lorpa watershed, HIMALI’s goals were to enhance the communities’ socioecological resilience to climate change and help design effective local watershed management plans to ensure the sustainability of agribusiness in the region. To identify and recommend solutions, project managers needed to better understand Lorpa’s present vegetation and how its land cover—specifically the forests—had changed over time. Given its geographic isolation, acquiring that picture with traditional, physical surveys would not be feasible. In order to both assess and map the area’s tree cover from the past to the present, the project team needed to have geospatial imagery and image analysis technology that would allow them to classify the vegetation, inventory the forest cover down to the tree-crown level and map that over time. The land classification solution also needed to be able to sufficiently handle the complexities of comparing and classifying vegetation within the challenging mountainous environment of steep slopes and dramatic changes in vegetation.
The Solution
The responsibility of producing the vegetation-change detection maps fell to Kathmandu’s International Centre for Integrated Mountain Development (ICIMOD), a regional knowledge centre serving the eight countries of the Hindu Kush Himalayas. An ICIMOD team acquired one 2006 QuickBird satellite image and one Ikonos image from 2011 for the change-detection land-cover maps. They also obtained a digital elevation model (DEM) from the shuttle radar topography mission (SRTM) for topographic detail as well as vector data such as buildings, roads and contours. As QuickBird and Ikonos have different resolutions, they integrated the ancillary data with each orthorectified satellite scene to create two separate rule sets within their Trimble® eCognition® software. After pre-processing and validating the quality of the raster data, the data-processing team used Esri’s ArcGIS to calculate multiple indexes to help separate vegetation from non-vegetation areas detail that would be integrated into the classification process. They then wrote customized rules and built two eCognition rule sets to distinguish and map 10 land-cover classes. Specific to the forest cover classes, they instructed the software to automatically delineate individual tree crowns into five size categories. Once the rule sets were complete, it only took the software 30 minutes to run the workflows and produce land-cover maps for 2006 and 2011 showing the change in the Lorpa’s vegetation between those two years. To validate the accuracy of eCognition’s automatic tree crown detection, the ICIMOD team chose ten 2.5-acre (1-hectare) sections at random on each pan-sharpened QuickBird and Ikonos image and manually digitized each visible crown in ArcGIS. They then compared their delineations with the software’s and found the 2011 tree crown classification was 99 percent accurate; the accuracy for 2006 was 97 percent.
Operational Impact
Quantitative Benefit


Case Study missing?
Start adding your own!
Register with your work email and create a new case study profile for your business.
Related Case Studies.
Case Study
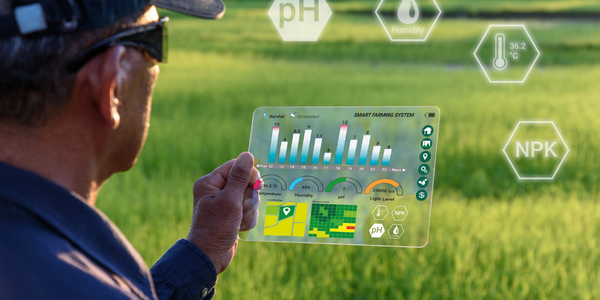
Intelligent Farming with ThingWorx Analytics
Z Farms was facing three challenges: costly irrigation systems with water as a limited resource, narrow optimal ranges of soil moisture for growth with difficult maintenance and farm operators could not simply turn on irrigation systems like a faucet.

Case Study
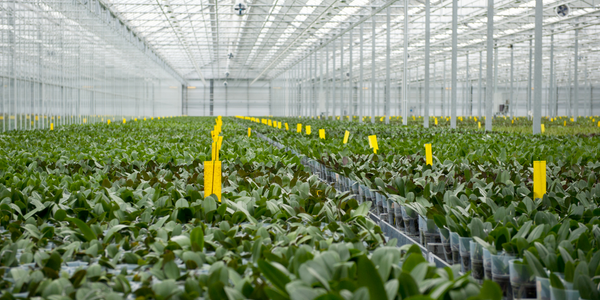
Greenhouse Intelligent Monitoring and Control Solution
Farming Orchids is the most successful form of precision farming in Taiwan, and also the most exported flower. Orchids need a specific temperature and humidity conditions to grow and bloom, and its flowering time may not be in line with market demands, so the price collapses when there is overproduction. Therefore, some farmers began to import automated greenhouse control systems for breeding and forcing, which not only improves quality, but also effectively controls the production period and yield to ensure revenue. In 2012, an orchid farmer built a Forcing Greenhouse of about 200 pings (approximately 661 Square Meters) in Tainan, Taiwan. The system integrator adopted Advantech’s APAX-5000 series programmable automation controllers to build the control platform, coupled with Advantech WebAccess HMI/SCADA software, to achieve cloud monitoring. The staff of the orchid field can monitor important data anytime via smart phone, iPad, and other handheld devices, and control the growth and flowering conditions. System requirements: In the past, most environmental control systems of orchid greenhouses in Taiwan used PLCs (Programmable Logic Controller) with poorscalability and control, and could not be connected to the Internet formonitoring from the cloud. For advanced database analysis and networking capability, the PC platform must be adopted. Therefore, PAC Systems (Programmable Automation Controller) with both PLC programming capabilities andPC functions is a better choice.The environmental control of the Orchid greenhouse switches on and off devices like fan, shade net, cooling/heat pump, liquid flow control, water-cooling wall etc. It is controlled by a control panel of electric controllers, and is driven by a motor, to adjust the greenhouse temperature, humidity, and other environmental conditions to the set parameters.

Case Study
Precision beekeeping with wireless temperature monitoring
Honeybees are insects of large economic value and provide a vital service to agriculture by pollinating a variety of crops. In addition, bees provide us with valuable products such as honey, beeswax, propolis, bee venom, etc. Monitoring of honeybee colony health, population, productivity, and environmental conditions affecting the colony health have always been exceedingly difficult tasks in apiculture. Research has shown that even small deviations (by more than 2°C) from the optimal temperatures have a significant influence on the development of the brood and the health of adult bees.
Case Study
Enabling Internet of Things Innovation in Agriculture
DigiBale, wanted to apply technology know-how and IP from implementations successfully to more agriculture sectors including cotton, forestry, sugarcane and cattle. However, farmers and growers still have worries about the connected technology.
