公司规模
Large Corporate
地区
- Europe
国家
- United Kingdom
产品
- IsoMetrix Solutions & Modules
技术栈
- QlikView
实施规模
- Enterprise-wide Deployment
影响指标
- Productivity Improvements
- Customer Satisfaction
技术
- 应用基础设施与中间件 - 数据交换与集成
适用行业
- 运输
- 建筑与基础设施
适用功能
- 物流运输
- 质量保证
用例
- 实时定位系统 (RTLS)
- 公共交通管理
服务
- 系统集成
- 软件设计与工程服务
关于客户
Golder UK 是一家环境咨询公司,在地球、环境和能源等专业领域提供独立的咨询、设计和施工服务。该公司的任务是实施一个系统,以收集伦敦和伯明翰之间高速铁路 2 号线项目利益相关者的反馈,并向下议院和上议院的私人法案请愿审查员汇报。该公司拥有 8000 名员工,一个站点有 14 名用户使用该系统。
挑战
Golder UK 的任务是实施一个系统,以收集伦敦和伯明翰之间高速铁路 2 号线项目利益相关者的回应,并向下议院和上议院的私人法案请愿审查员汇报。该项目的简要内容是收集和监控利益相关者的回应,以便向审查员汇报。需要收集回应的所有方面,包括沟通形式、关注区域的位置以及关注的性质。除此之外,还必须实施严格的控制,确保不会重复收集回应。
解决方案
在三周的时间里,由三人组成的 IsoMetrix 团队配置并实施了定制解决方案,该解决方案无需离开 IsoMetrix 办公室即可满足 Golder UK 的所有要求。Golder 团队需要能够向 The Examiners 发送利益相关者对 High Speed 2 项目的回应的总结性关键报告。开发了此功能以及包括表格、图形、图表、地图和仪表盘在内的众多仪表板。该解决方案在 Metrix 云服务器上进行了试点,试点完成后随后转移到 Golder 在欧洲的服务器上。它将在 High Speed 2 项目期间继续使用,不断监控和评估与利益相关者互动中出现的新趋势。
运营影响
数量效益

Case Study missing?
Start adding your own!
Register with your work email and create a new case study profile for your business.
相关案例.
Case Study
IoT System for Tunnel Construction
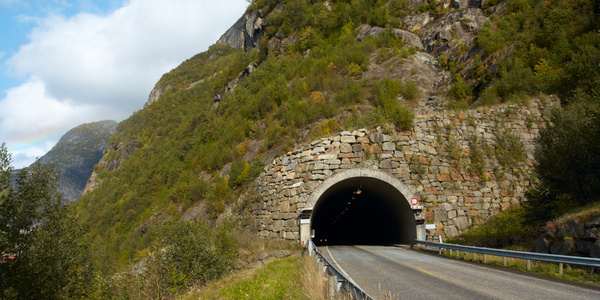
The Zenitaka Corporation ('Zenitaka') has two major business areas: its architectural business focuses on structures such as government buildings, office buildings, and commercial facilities, while its civil engineering business is targeted at structures such as tunnels, bridges and dams. Within these areas, there presented two issues that have always persisted in regard to the construction of mountain tunnels. These issues are 'improving safety" and "reducing energy consumption". Mountain tunnels construction requires a massive amount of electricity. This is because there are many kinds of electrical equipment being used day and night, including construction machinery, construction lighting, and ventilating fan. Despite this, the amount of power consumption is generally not tightly managed. In many cases, the exact amount of power consumption is only ascertained when the bill from the power company becomes available. Sometimes, corporations install demand-monitoring equipment to help curb the maximum power demanded. However, even in these cases, the devices only allow the total volume of power consumption to be ascertained, or they may issue warnings to prevent the contracted volume of power from being exceeded. In order to tackle the issue of reducing power consumption, it was first necessary to obtain an accurate breakdown of how much power was being used in each particular area. In other words, we needed to be able to visualize the amount of power being consumed. Safety, was also not being managed very rigorously. Even now, tunnel construction sites often use a 'name label' system for managing entry into the work site. Specifically, red labels with white reverse sides that bear the workers' names on both sides are displayed at the tunnel work site entrance. The workers themselves then flip the name label to the appropriate side when entering or exiting from the work site to indicate whether or not they are working inside the tunnel at any given time. If a worker forgets to flip his or her name label when entering or exiting from the tunnel, management cannot be performed effectively. In order to tackle the challenges mentioned above, Zenitaka decided to build a system that could improve the safety of tunnel construction as well as reduce the amount of power consumed. In other words, this new system would facilitate a clear picture of which workers were working in each location at the mountain tunnel construction site, as well as which processes were being carried out at those respective locations at any given time. The system would maintain the safety of all workers while also carefully controlling the electrical equipment to reduce unnecessary power consumption. Having decided on the concept, our next concern was whether there existed any kind of robust hardware that would not break down at the construction work site, that could move freely in response to changes in the working environment, and that could accurately detect workers and vehicles using radio frequency identification (RFID). Given that this system would involve many components that were new to Zenitaka, we decided to enlist the cooperation of E.I.Sol Co., Ltd. ('E.I.Sol') as our joint development partner, as they had provided us with a highly practical proposal.
Case Study
Airport SCADA Systems Improve Service Levels
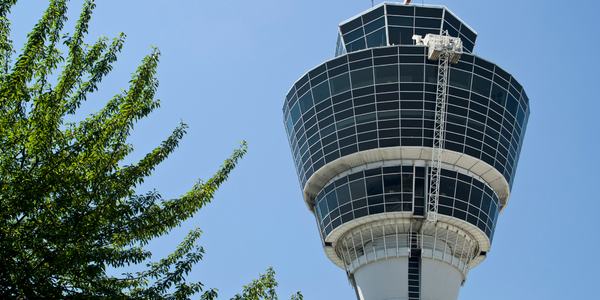
Modern airports are one of the busiest environments on Earth and rely on process automation equipment to ensure service operators achieve their KPIs. Increasingly airport SCADA systems are being used to control all aspects of the operation and associated facilities. This is because unplanned system downtime can cost dearly, both in terms of reduced revenues and the associated loss of customer satisfaction due to inevitable travel inconvenience and disruption.
Case Study
IoT-based Fleet Intelligence Innovation
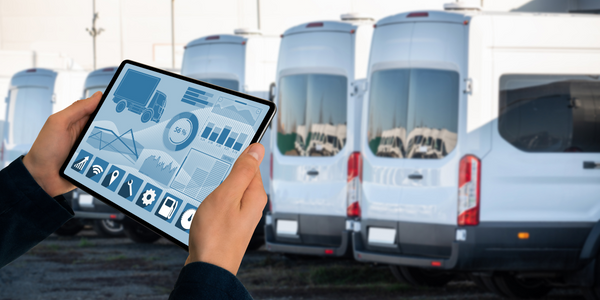
Speed to market is precious for DRVR, a rapidly growing start-up company. With a business model dependent on reliable mobile data, managers were spending their lives trying to negotiate data roaming deals with mobile network operators in different countries. And, even then, service quality was a constant concern.
Case Study
Digitize Railway with Deutsche Bahn
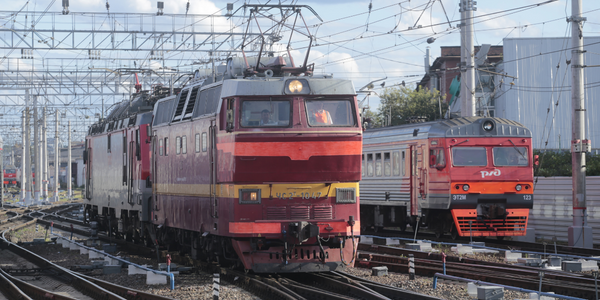
To reduce maintenance costs and delay-causing failures for Deutsche Bahn. They need manual measurements by a position measurement system based on custom-made MEMS sensor clusters, which allow autonomous and continuous monitoring with wireless data transmission and long battery. They were looking for data pre-processing solution in the sensor and machine learning algorithms in the cloud so as to detect critical wear.
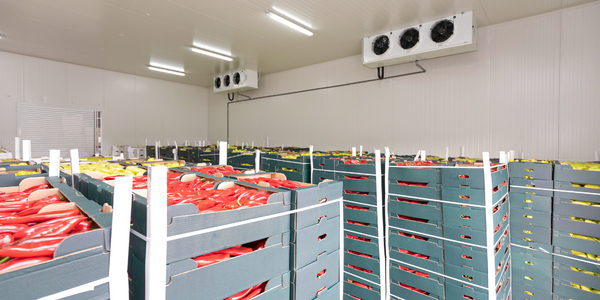
Case Study
Cold Chain Transportation and Refrigerated Fleet Management System
1) Create a digital connected transportation solution to retrofit cold chain trailers with real-time tracking and controls. 2) Prevent multi-million dollar losses due to theft or spoilage. 3) Deliver a digital chain-of-custody solution for door to door load monitoring and security. 4) Provide a trusted multi-fleet solution in a single application with granular data and access controls.

Case Study
Vehicle Fleet Analytics
Organizations frequently implement a maintenance strategy for their fleets of vehicles using a combination of time and usage based maintenance schedules. While effective as a whole, time and usage based schedules do not take into account driving patterns, environmental factors, and sensors currently deployed within the vehicle measuring crank voltage, ignition voltage, and acceleration, all of which have a significant influence on the overall health of the vehicle.In a typical fleet, a large percentage of road calls are related to electrical failure, with battery failure being a common cause. Battery failures result in unmet service agreement levels and costly re-adjustment of scheduled to provide replacement vehicles. To reduce the impact of unplanned maintenance, the transportation logistics company was interested in a trial of C3 Vehicle Fleet Analytics.


